Know Your Fields. Make Every Decision Count: From Land Preparation to Harvesting
Track crop vigour, moisture, nitrogen uptake and growth with satellite updates every five days, AI-driven zoning and crop water need calculations along with weather analytics all in one crop monitoring platform.
From satellite pass to action on the field
Map your fields
Draw field boundaries in the app or share them with us. Add crop type and sowing date.
Satellites scan
New imagery is captured on every satellite pass and cloud-filtered.
AI analyses
Indices are calculated zone by zone and AI flags health, irrigation and yield risks.
You act
Get alerts on your phone, variable-rate maps for fertilizer and irrigation, and directions to problem zones.
Farm Satellite to Actionable Insights Throughout the Season
Crop Vigor
How green and actively growing the canopy is. Weak zones show up as low values long before yellowing is visible.
Crop Moisture
Water content in the leaves and canopy, so you catch water stress early and irrigate only where it is needed.
Crop Nitrogen
Chlorophyll and nitrogen status from red-edge bands, showing which zones are under- or over-fed.
Early Crop Growth
Leaf area, crop stage and growth curve across the season, compared against previous seasons.
Crop Monitoring System Overview
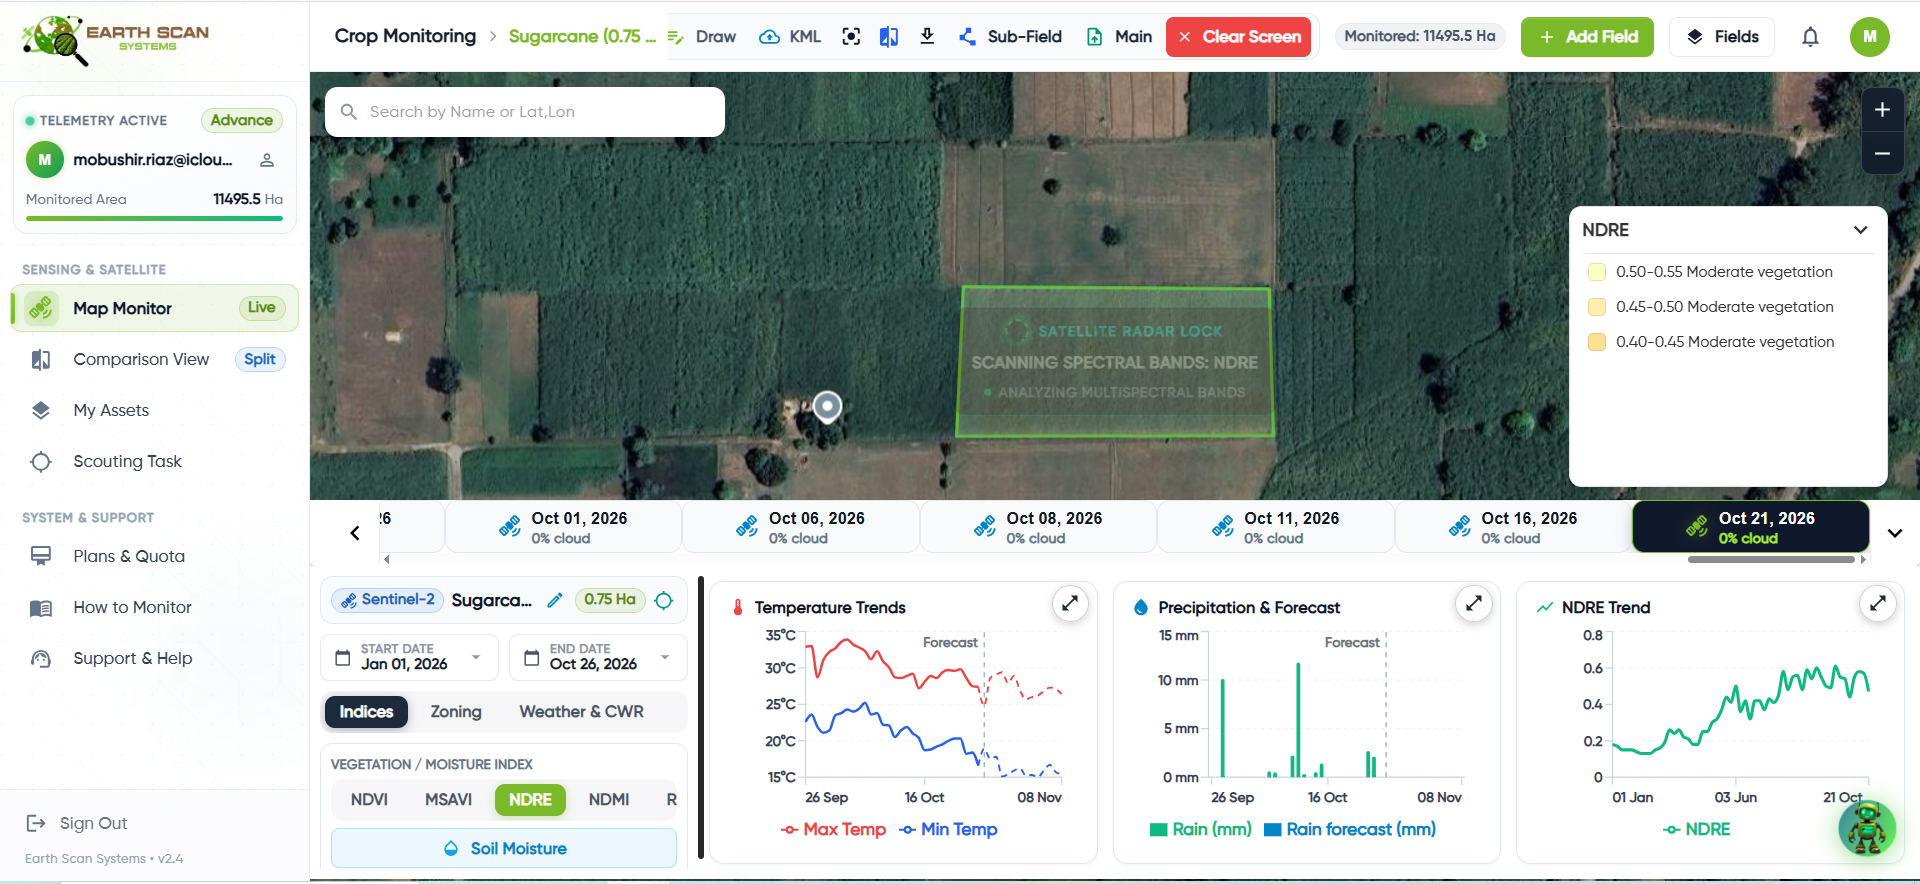
Click hereto explore each crop index.
Crop Vigor
Shows how green and actively growing the canopy is. Low zones are where the crop is under stress.
Typical reading guide
Interpret readings against crop stage, field history, soil and recent weather.
What to do: Scout the flagged zones first the mobile app guides you straight to them.
Switch the index above to see how the same field looks through each lens.
Weather intelligence and field scouting, built in
Agrometeorology & Weather
- 14-day hyperlocal forecasts at 90 m resolution
- Historical weather since 1979 for climate trends
- Cold and heat stress alerts
- Integration with Automatic Weather Stations (AWS)
Mobile App for Field Scouting
- GPS-enabled, works offline in the field
- Navigate straight to flagged problem zones
- Report issues with photos in real time
- Get expert recommendations back
See field and weather intelligence in one clear view
Review forecasts, seasonal trends and field analytics designed to support timely crop and irrigation decisions.
Click hereto explore each analytics view.
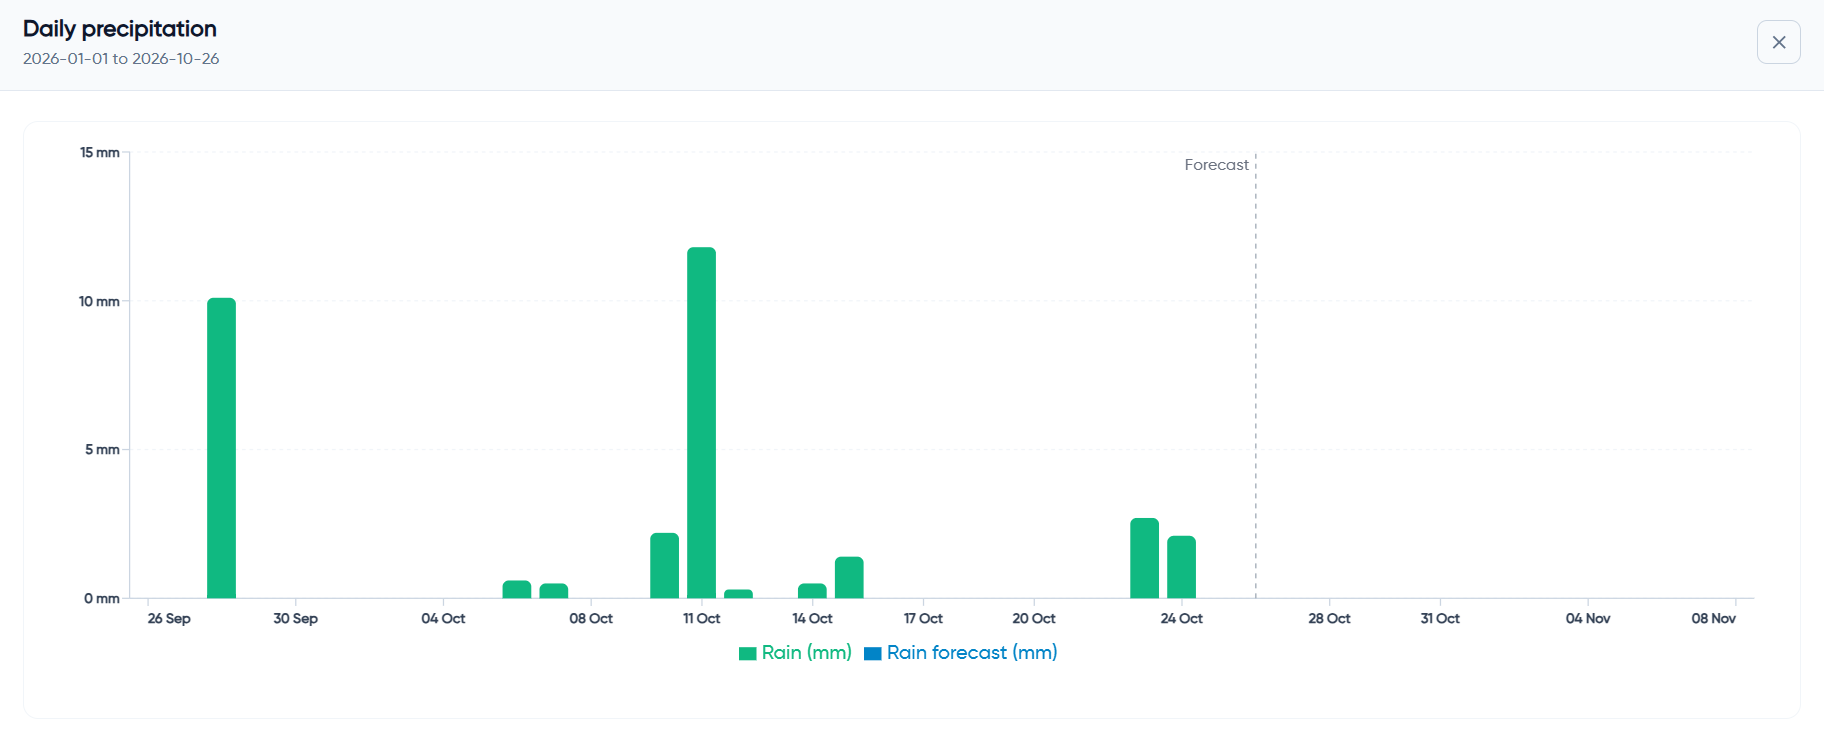
Daily Precipitation History & Forecast
Track daily rainfall over time and compare recorded precipitation with upcoming forecast conditions to understand water availability across the season.
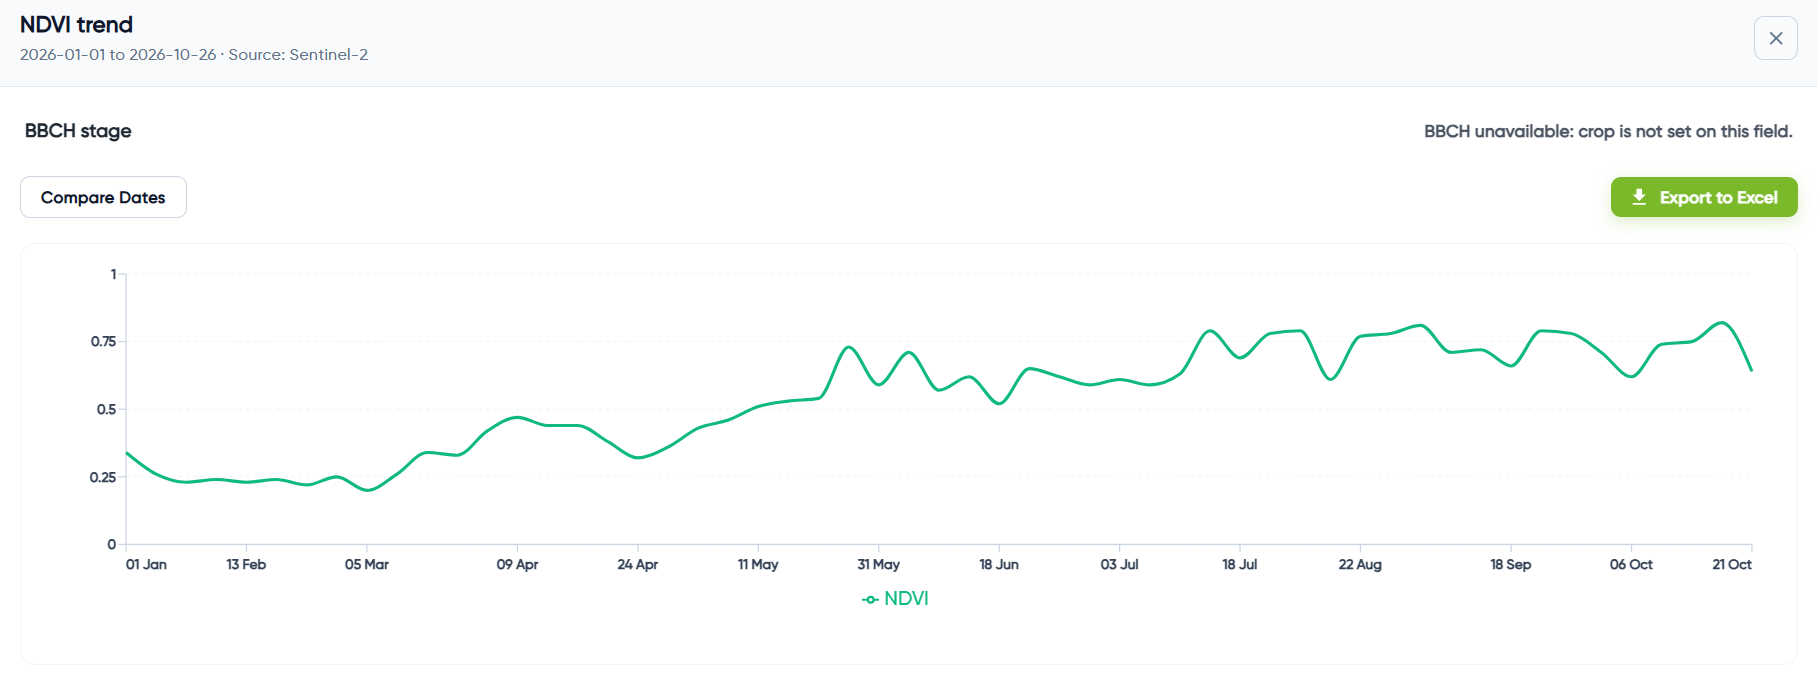
NDVI Crop Health Trend
Follow changes in crop vegetation health throughout the season and quickly identify periods of stronger growth or possible crop stress.
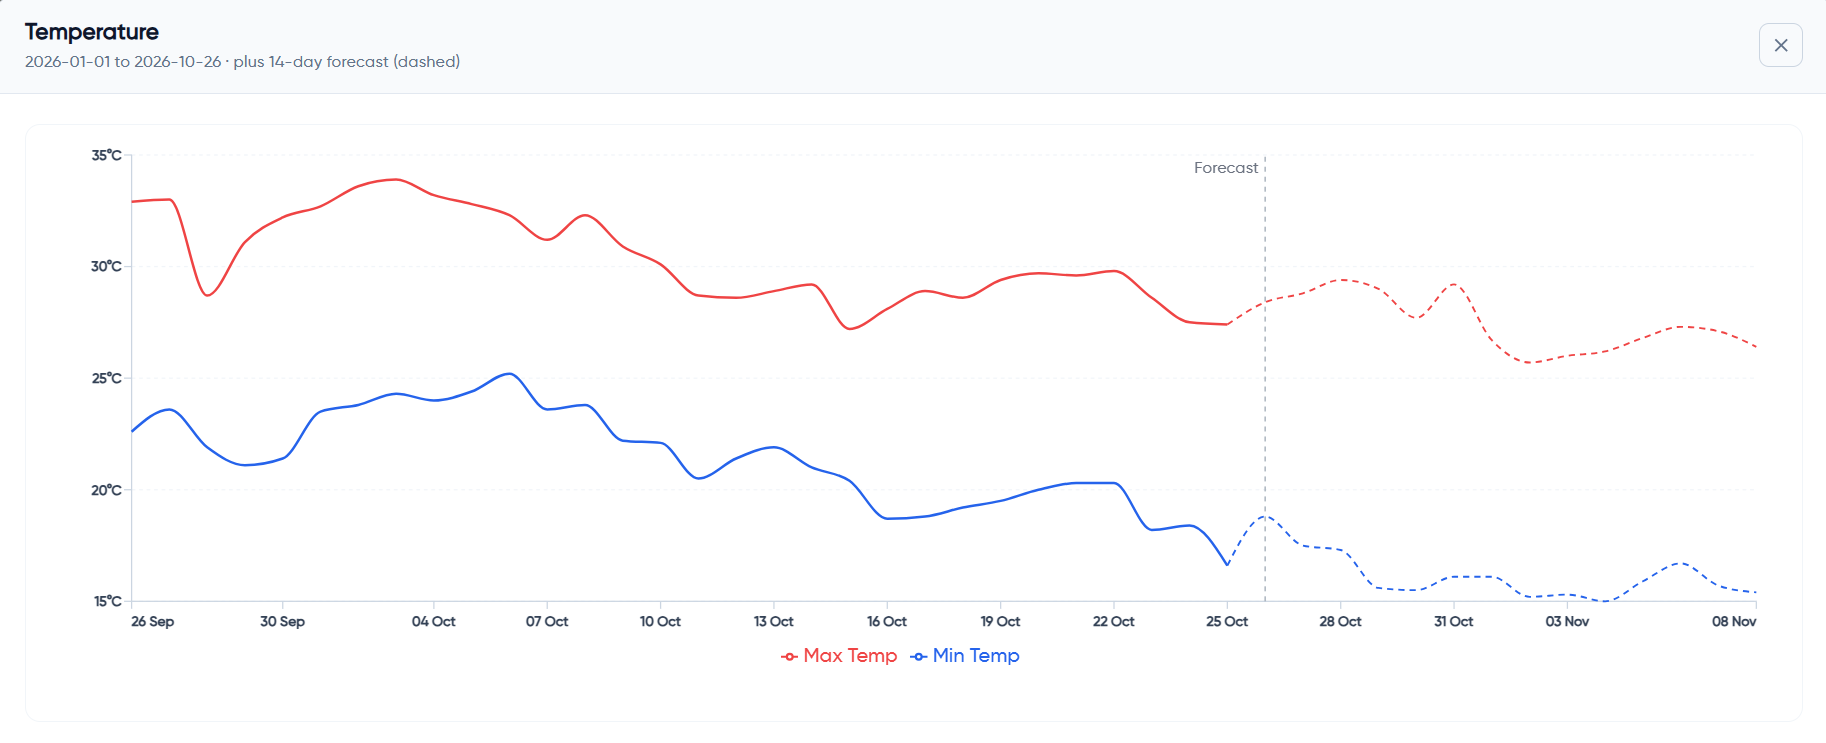
Temperature Trends & Forecast
Review historical minimum and maximum temperatures alongside the 14-day forecast to prepare for changing field conditions.
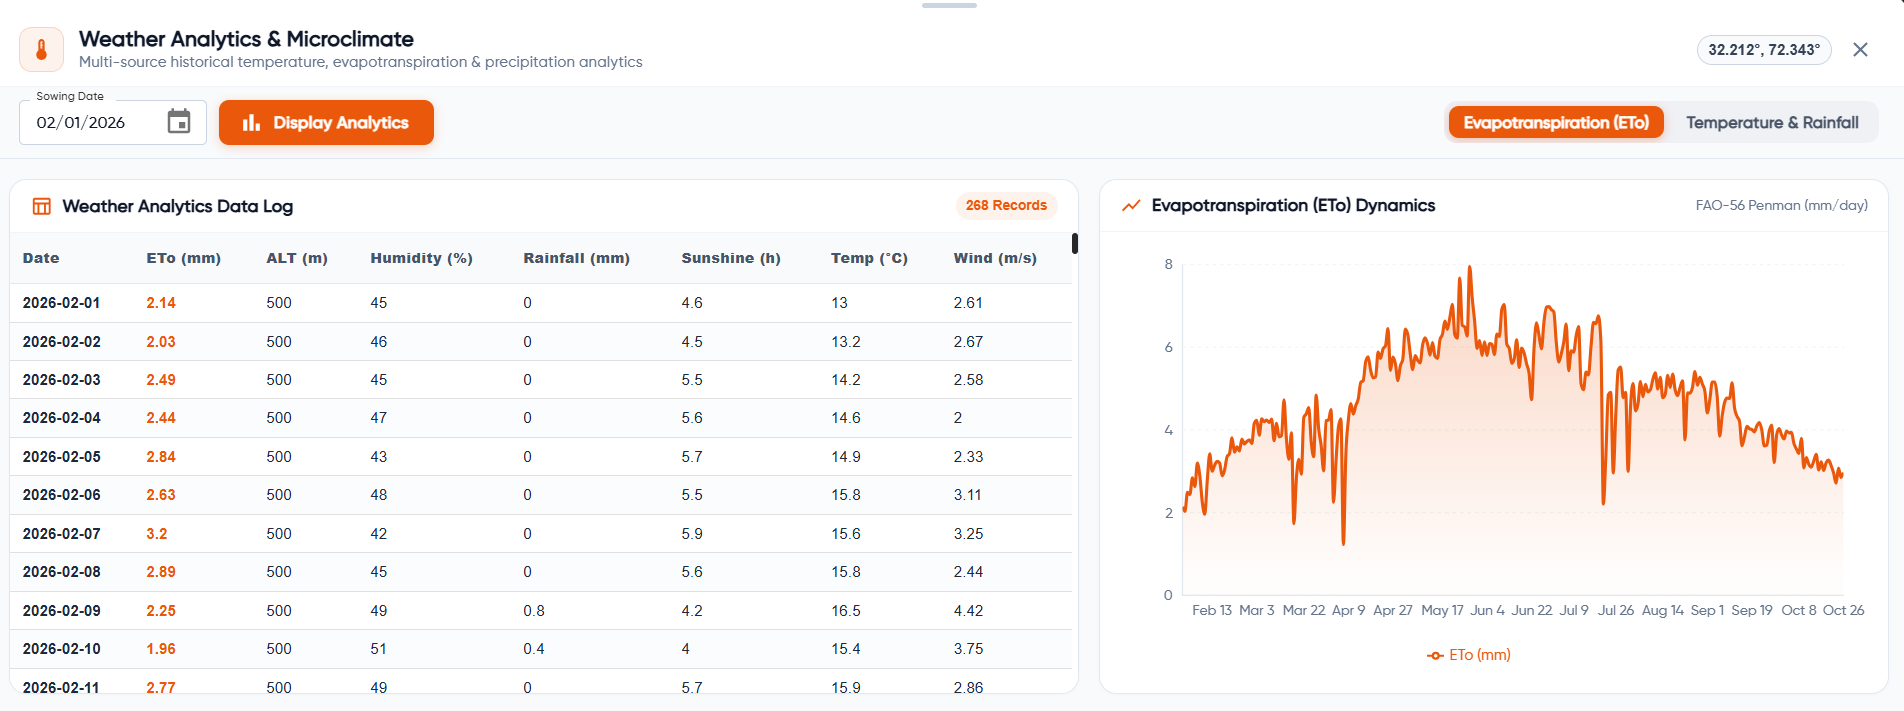
Evapotranspiration & Microclimate Analytics
Review daily evapotranspiration together with humidity, rainfall, sunshine, temperature and wind data to better understand field water demand.
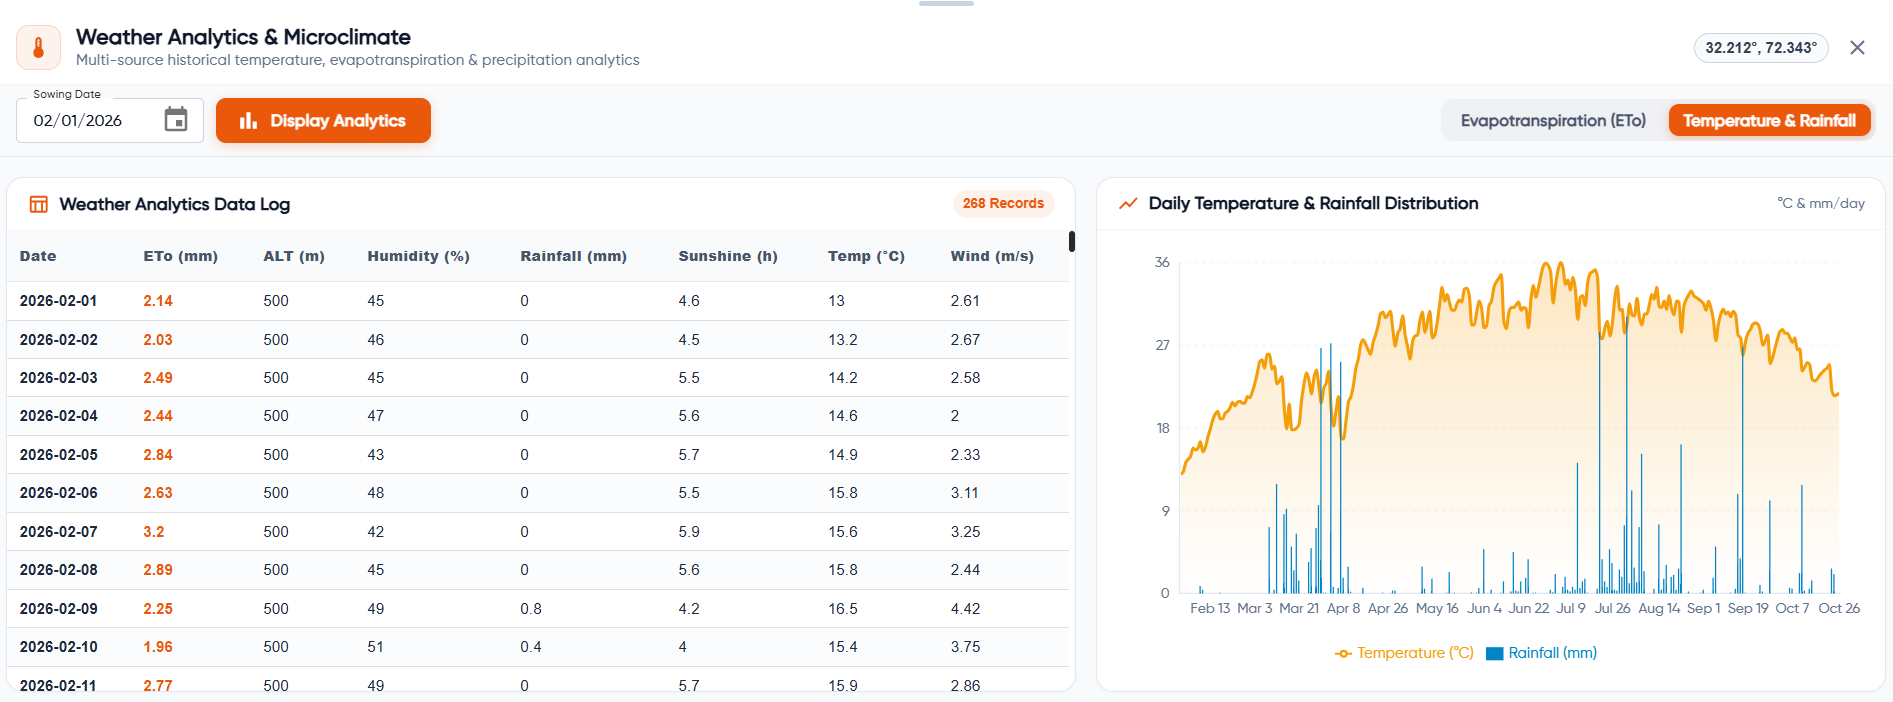
Temperature & Rainfall Analytics
Compare temperature and rainfall patterns across the season to understand changing weather conditions and support day-to-day farm planning.
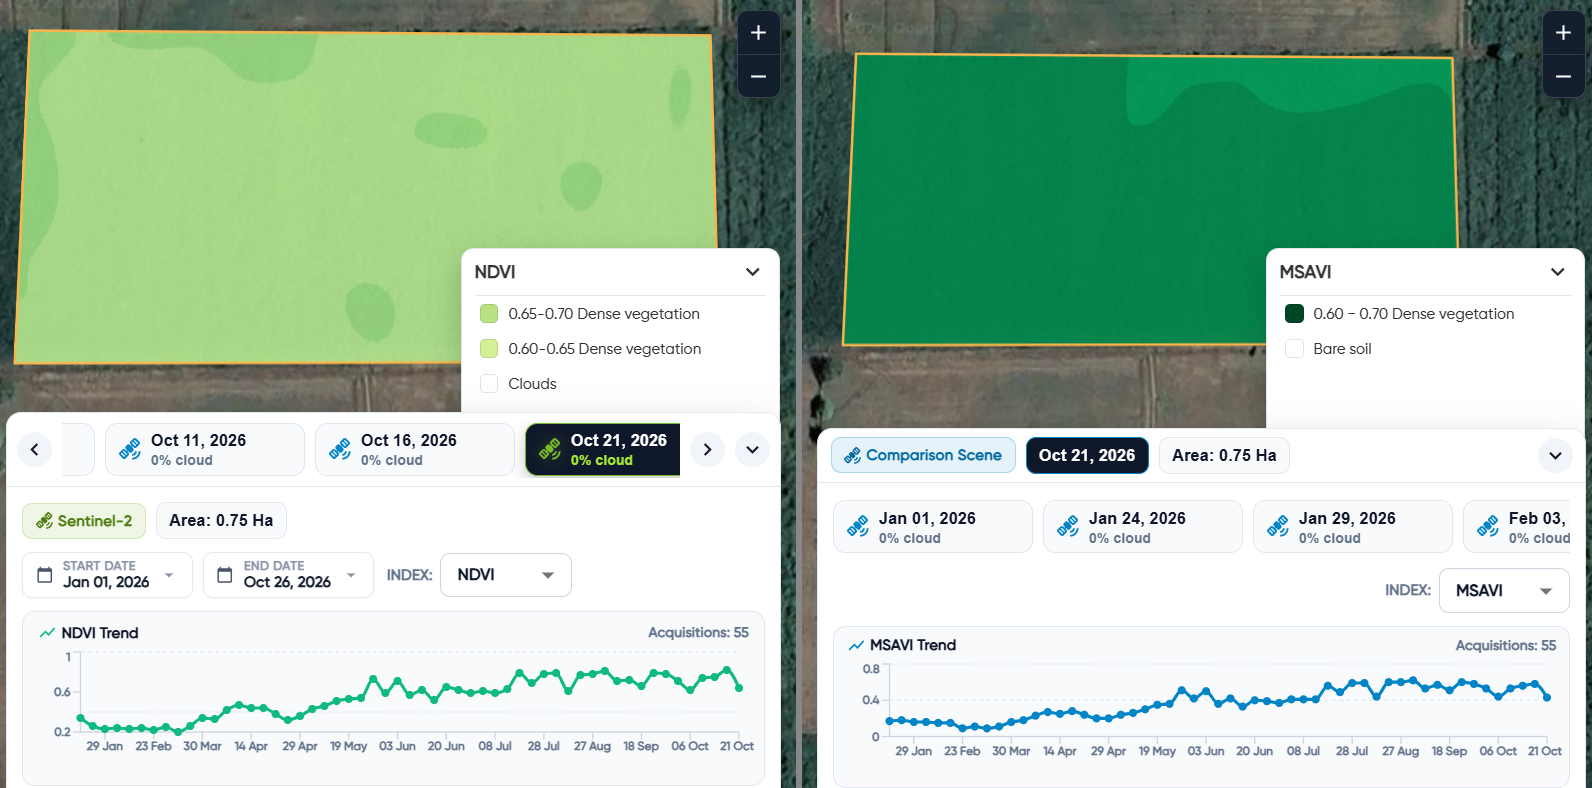
Compare Crop Health Across Vegetation Indices
View NDVI and MSAVI side by side to compare crop condition, vegetation density, and seasonal growth patterns across the same field. This helps you understand how field performance changes over time and identify areas that may need closer attention.
Evapotranspiration Dynamics
Focus on the evapotranspiration chart to review changes in daily field water loss across the season.
Weather Analytics Data Log
Focus on the weather data table to review daily evapotranspiration, altitude, humidity, rainfall, sunshine, temperature and wind readings.
Daily Temperature & Rainfall Distribution
Focus on the combined chart to compare seasonal temperature patterns with daily rainfall distribution.
